簡介
mpldatacursor包可以為matplotlib提供交互式的數(shù)據(jù)光標(彈出式注釋框)����。
它的典型功能是:
鼠標左鍵單擊圖表數(shù)據(jù)元素時會彈出文本框顯示最近的數(shù)據(jù)元素的坐標值�。鼠標右鍵單擊文本框取消顯示數(shù)據(jù)光標。- 按
d鍵時切換顯示\關(guān)閉數(shù)據(jù)光標����。

安裝
如果matplotlib版本低于3.3可以直接使用pip安裝
pip install mpldatacursor
如果matplotlib版本高于3.3,雖然pip安裝成功����,但是運行案例時會出現(xiàn)AttributeError: 'ScalarFormatter' object has no attribute 'pprint_val'錯誤。
通過查看源碼可知:
try:
  # Again, older versions of mpl
  return formatter.pprint_val(x)
except AttributeError:
  # 3.3.0 or later
  return formatter.format_data_short(x)
通過分析�,預計是因為使用了國內(nèi)pip源,mpldatacursor包還未修復該問題(pip 安裝的 mpldatacursor包版本號是0.7.1)�。
因此,建議到https://github.com/joferkington/mpldatacursor
下載源碼����,進行源碼安裝(源碼安裝的 mpldatacursor包版本號是0.7.dev0)。
基本應用(官方實例)解析
應用流程
mpldatacursor包基本應用方式比較簡單:
- 從
mpldatacursor包中導入datacursor函數(shù)�����。
- 應用
datacursor函數(shù)����。
包結(jié)構(gòu)
查看源碼可知,mpldatacursor包的結(jié)構(gòu)如下:
mpldatacursor
   convenience.py
   datacursor.py
   pick_info.py
   __init__.py
datacursor函數(shù)定義在convenience.py中����,datacursor函數(shù)的返回值是DataCursor類實例。
DataCursor類定義在datacursor.py中��。
pick_info.py定義了一系列和彈出文本框相關(guān)的函數(shù)�����,供DataCursor類調(diào)用���。
datacursor函數(shù)定義
由 datacursor函數(shù)定義可知:
datacursor函數(shù)可以不提供參數(shù)���,這樣圖像內(nèi)所有數(shù)據(jù)元素都會應用交互式數(shù)據(jù)光標。datacursor函數(shù)可以指定哪些數(shù)據(jù)元素應用交互式數(shù)據(jù)光標����。
def datacursor(artists=None, axes=None, **kwargs):
  """
  Create an interactive data cursor for the specified artists or specified
  axes. The data cursor displays information about a selected artist in a
  "popup" annotation box.

  If a specific sequence of artists is given, only the specified artists will
  be interactively selectable. Otherwise, all manually-plotted artists in
  *axes* will be used (*axes* defaults to all axes in all figures).

  Parameters
  -----------
  artists : a matplotlib artist or sequence of artists, optional
    The artists to make selectable and display information for. If this is
    not specified, then all manually plotted artists in `axes` will be
    used.
  axes : a matplotlib axes of sequence of axes, optional
    The axes to selected artists from if a sequence of artists is not
    specified. If `axes` is not specified, then all available axes in all
    figures will be used.
  tolerance : number, optional
    The radius (in points) that the mouse click must be within to select
    the artist. Default: 5 points.
  formatter : callable, optional
    A function that accepts arbitrary kwargs and returns a string that will
    be displayed with annotate. Often, it is convienent to pass in the
    format method of a template string, e.g.
    ``formatter="{label}".format``.
    Keyword arguments passed in to the `formatter` function:
      `x`, `y` : floats
        The x and y data coordinates of the clicked point
      `event` : a matplotlib ``PickEvent``
        The pick event that was fired (note that the selected
        artist can be accessed through ``event.artist``).
      `label` : string or None
        The legend label of the selected artist.
      `ind` : list of ints or None
        If the artist has "subitems" (e.g. points in a scatter or
        line plot), this will be a list of the item(s) that were
        clicked on. If the artist does not have "subitems", this
        will be None. Note that this is always a list, even when
        a single item is selected.
    Some selected artists may supply additional keyword arguments that
    are not always present, for example:
      `z` : number
        The "z" (usually color or array) value, if present. For an
        ``AxesImage`` (as created by ``imshow``), this will be the
        uninterpolated array value at the point clicked. For a
        ``PathCollection`` (as created by ``scatter``) this will be the
        "c" value if an array was passed to "c".
      `i`, `j` : ints
        The row, column indicies of the selected point for an
        ``AxesImage`` (as created by ``imshow``)
      `s` : number
        The size of the selected item in a ``PathCollection`` if a size
        array is specified.
      `c` : number
        The array value displayed as color for a ``PathCollection``
        if a "c" array is specified (identical to "z").
      `point_label` : list
        If `point_labels` is given when the data cursor is initialized
        and the artist has "subitems", this will be a list of the items
        of `point_labels` that correspond to the selected artists.
        Note that this is always a list, even when a single artist is
        selected.
      `width`, `height`, `top`, `bottom` : numbers
        The parameters for ``Rectangle`` artists (e.g. bar plots).
  point_labels : sequence or dict, optional
    For artists with "subitems" (e.g. Line2D's), the item(s) of
    `point_labels` corresponding to the selected "subitems" of the artist
    will be passed into the formatter function as the "point_label" kwarg.
    If a single sequence is given, it will be used for all artists with
    "subitems". Alternatively, a dict of artist:sequence pairs may be given
    to match an artist to the correct series of point labels.
  display : {"one-per-axes", "single", "multiple"}, optional
    Controls whether more than one annotation box will be shown.
    Default: "one-per-axes"
  draggable : boolean, optional
    Controls whether or not the annotation box will be interactively
    draggable to a new location after being displayed. Defaults to False.
  hover : boolean, optional
    If True, the datacursor will "pop up" when the mouse hovers over an
    artist. Defaults to False. Enabling hover also sets
    `display="single"` and `draggable=False`.
  props_override : function, optional
    If specified, this function customizes the parameters passed into the
    formatter function and the x, y location that the datacursor "pop up"
    "points" to. This is often useful to make the annotation "point" to a
    specific side or corner of an artist, regardless of the position
    clicked. The function is passed the same kwargs as the `formatter`
    function and is expected to return a dict with at least the keys "x"
    and "y" (and probably several others).
    Expected call signature: `props_dict = props_override(**kwargs)`
  keybindings : boolean or dict, optional
    By default, the keys "d" and "t" will be bound to deleting/hiding all
    annotation boxes and toggling interactivity for datacursors,
    respectively. If keybindings is False, the ability to hide/toggle
    datacursors interactively will be disabled. Alternatively, a dict of
    the form {'hide':'somekey', 'toggle':'somekey'} may specified to
    customize the keyboard shortcuts.
  date_format : string, optional
    The strftime-style formatting string for dates. Used only if the x or y
    axes have been set to display dates. Defaults to "%x %X".
  display_button: int, optional
    The mouse button that will triggers displaying an annotation box.
    Defaults to 1, for left-clicking. (Common options are 1:left-click,
    2:middle-click, 3:right-click)
  hide_button: int or None, optional
    The mouse button that triggers hiding the selected annotation box.
    Defaults to 3, for right-clicking. (Common options are 1:left-click,
    2:middle-click, 3:right-click, None:hiding disabled)
  keep_inside : boolean, optional
    Whether or not to adjust the x,y offset to keep the text box inside the
    figure. This option has no effect on draggable datacursors. Defaults to
    True. Note: Currently disabled on OSX and NbAgg/notebook backends.
  **kwargs : additional keyword arguments, optional
    Additional keyword arguments are passed on to annotate.

  Returns
  -------
  dc : A ``mpldatacursor.DataCursor`` instance
  """
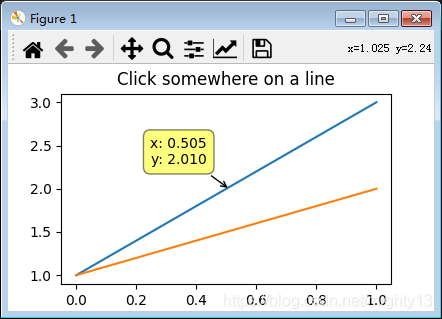
官方實例源碼
import matplotlib.pyplot as plt
import numpy as np
from mpldatacursor import datacursor

data = np.outer(range(10), range(1, 5))

fig, ax = plt.subplots()
lines = ax.plot(data)
ax.set_title('Click somewhere on a line')

datacursor()

plt.show()
限定僅某數(shù)據(jù)元素使用交互式光標
本實例中,有兩個數(shù)據(jù)元素(artist):line1和line2���,datacursor(line1)函數(shù)提供了參數(shù)line1��,因此只有line1可以使用交互式數(shù)據(jù)光標����,line2則沒有效果。
import matplotlib.pyplot as plt
import numpy as np
from mpldatacursor import datacursor
fig, ax = plt.subplots()
line1 = ax.plot([1,3])
line2 = ax.plot([1,2])
ax.set_title('Click somewhere on a line')
datacursor(line1)
plt.show()
其他官方實例功能概述
mpldatacursor提供了大量實際案例�,詳見https://github.com/joferkington/mpldatacursor/tree/master/examples。不再一一分析����,僅簡單說明功能。
basic_single_annotation.py:在多子圖情況下��,默認每個子圖的數(shù)據(jù)光標是獨立的���,即每個子圖都可以顯示數(shù)據(jù)光標�,相互不影響����。使用datacursor(display='single')參數(shù)后,僅在當前子圖顯示數(shù)據(jù)光標����,其余子圖顯示的數(shù)據(jù)光標自動關(guān)閉��。change_popup_color.py:提供了兩個案例�,一個取消了提示框的邊框�����,一個將提示框的背景色改為白色����。hover_example.py:將數(shù)據(jù)光標的觸發(fā)方式由鼠標左鍵單擊改為鼠標懸浮����。show_artist_labels.py:將數(shù)據(jù)光標默認顯示的坐標值改為數(shù)據(jù)元素的label。highlighting_example.py:點擊數(shù)據(jù)元素時����,數(shù)據(jù)元素會高亮(黃色)顯示。draggable_example.py:在一個子圖中����,同時顯示多個數(shù)據(jù)光標。customize_keyboard_shortcuts.py:重新綁定數(shù)據(jù)光標快捷鍵���。labeled_points_example.py:自定義數(shù)據(jù)點標簽�。date_example.py:日期數(shù)據(jù)顯示。bar_example.py:在柱狀圖中����,在每個柱上方鼠標懸浮觸發(fā)數(shù)據(jù)光標。
總結(jié)
mpldatacursor歷史悠久����,但是遲遲沒有發(fā)布支持matplotlib3.3的穩(wěn)定版,建議源碼安裝開發(fā)版����,或者使用mplcursors包https://github.com/anntzer/mplcursors。
mpldatacursor功能上還是挺豐富的��,可以作為深入學習matplotlib交互的案例����。
到此這篇關(guān)于matplotlib交互式數(shù)據(jù)光標mpldatacursor的實現(xiàn) 的文章就介紹到這了,更多相關(guān)matplotlib交互式數(shù)據(jù)光標內(nèi)容請搜索腳本之家以前的文章或繼續(xù)瀏覽下面的相關(guān)文章希望大家以后多多支持腳本之家!
您可能感興趣的文章:- matplotlib交互式數(shù)據(jù)光標實現(xiàn)(mplcursors)

